AS A 19 YEAR CYCLE ENDS A NEW CYCLE BEGINS
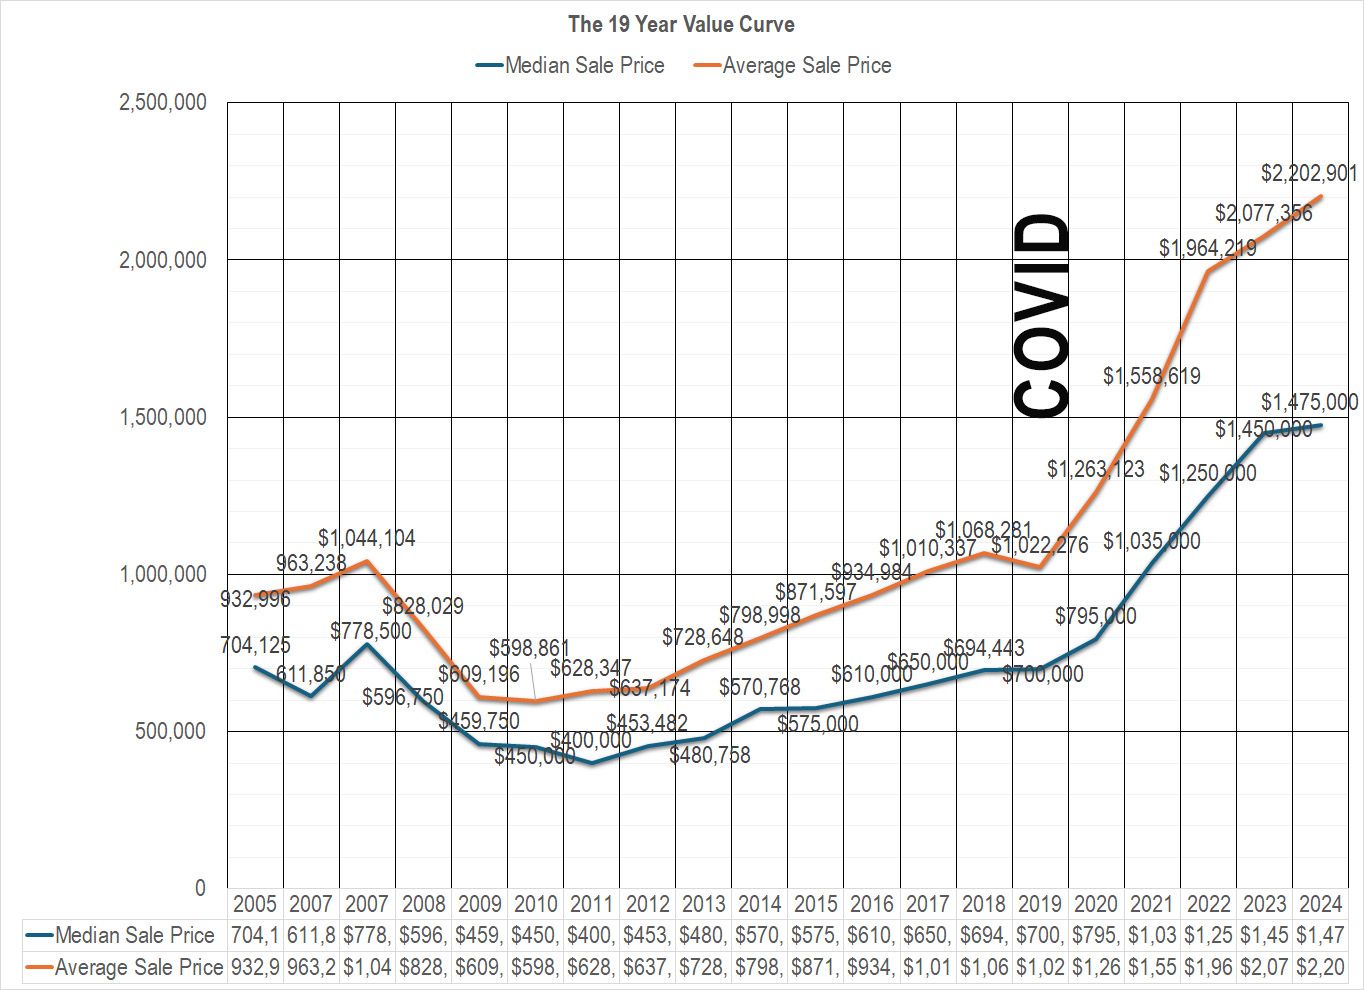
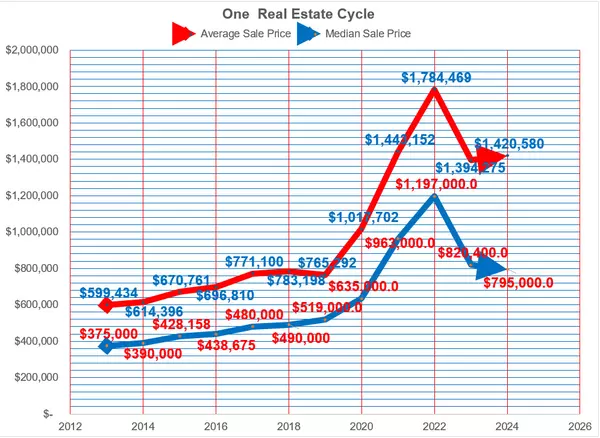
The spreadsheet shows data for average and median sale prices from 2005 to 2024, revealing several distinct cycles in the local real estate market:
- Pre-2008 Boom (2005-2007):
- Average sale price increased from $932,996 in 2005 to $1,044,104 in 2007
- Median sale price rose from $704,125 to $778,500
 March 26, 2025 Researched & Written By Richard Eimers Broker Owner, Beach Road Realty
Data comes from the Emerald Coast Association of Realtors
- Great Recession Impact (2008-2011):
- Sharp decline in prices, with the median sale price dropping to $400,000 in 2011
- Average sale price fell to $628,347 in 2011
- Recovery and Growth (2012-2019):
- Steady increase in prices, with the median sale price reaching $700,000 by 2019
- Average sale price grew to $1,022,276 in 2019
- Pandemic Boom (2020-2024):
- Rapid price acceleration, with the median sale price jumping to $1,475,000 by 2024
- Average sale price surged to $2,202,901 in 2024
Market Activity Indicators
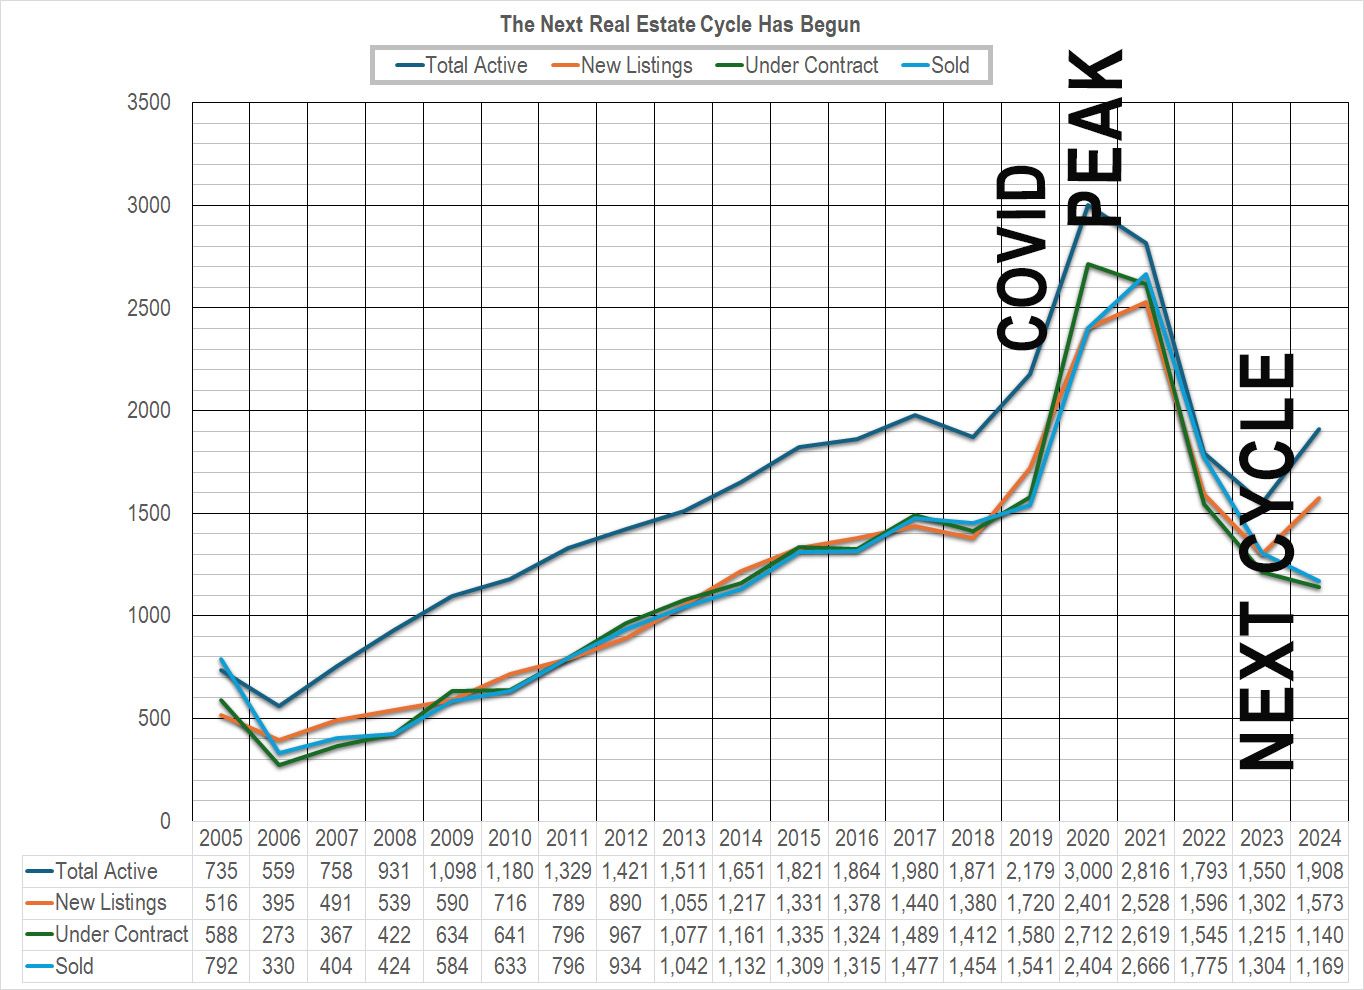
The spreadsheet also provides data on market activity from 2005 to 2024, showing:
- Total Active Listings:
- Increased from 735 in 2005 to a peak of 3,000 in 2020
- Declined to 1,908 by 2024, indicating a tightening of inventory
- New Listings:
- Grew from 516 in 2005 to 2,528 in 2021
- Decreased to 1,573 in 2024, suggesting a slowdown in new inventory
- Properties Under Contract:
- Fluctuated over the years, with a low of 273 in 2006 and a high of 2,712 in 2020
- Stood at 1,140 in 2024, indicating a moderating market
- Sold Properties:
- Ranged from a low of 330 in 2006 to a peak of 2,666 in 2021
- Decreased to 1,169 in 2024, reflecting a cooling market
Analysis of Real Estate Cycles
- Boom-Bust Cycle (2005-2011):
The market experienced a significant boom followed by a bust during the Great Recession. This cycle was characterized by rapid price appreciation, followed by a sharp decline and a period of price stagnation. - Recovery and Steady Growth (2012-2019):
This period saw a gradual but consistent increase in prices and market activity, indicating a healthy recovery and sustainable growth in the local real estate market. - Pandemic-Induced Surge (2020-2024):
The most recent cycle shows an unprecedented rise in prices and market activity, likely driven by factors such as low interest rates, increased demand for vacation properties, and shifts in work-from-home policies.
Current Market Conditions
As of March 2025, the data suggests that the market may be entering a new phase:
- Prices have reached historic highs, with the median sale price at $1,475,000
- Market activity indicators (new listings, properties under contract, and sold properties) are showing signs of moderation
- Total active listings have increased from the low point in 2023, suggesting growing inventory
This data indicates that the market may be transitioning from the intense seller's market of the past few years towards a more balanced market. As a real estate expert in these beach communities, I would advise buyers and sellers to closely monitor these trends and adjust their strategies accordingly.
Recent Posts

The Truth about Selling Your Home Solo

Buckle Up Buttercup

Home Prices Remain Flat, but Buyers Have More Inventory To Choose From

Bitcoin or Beach Homes? Converting Dollars into Real Value
Market Update for Florida Homebuyers: Interest Rates Could Drop as Job Market Cools

AS A 19 YEAR CYCLE ENDS A NEW CYCLE BEGINS

THE IMPACT OF ECONOMIC SHIFTS ON RESORT REAL ESTATE IN FLORIDA'S EMERALD COAST
Destin, Santa Rosa Beach, and Inlet Beach Resort Markets: The 2025 Window of Opportunity
NAVIGATING THE SHIFTING SANDS: REAL ESTATE TRENDS IN DESTIN, 30A, AND BEYOND (2013-2025)

Preparing to Sell Your Home: A Comprehensive Guide
